WashU hits a winner at Diamond Dollars competition
- April 26, 2018
- By Guest Author
- 4 minute read

Written by the winning competition team on behalf of the WashU Sports Analytics Club.
Over spring break, a team of five students from the Olin-recognized Sports Analytics Club traveled to Phoenix, Arizona, for the Diamond Dollars Case Competition at the SABR Analytics Conference. Out of 23 teams in the competition, the WashU team finished first.
Jarod Bacon, LA 2021, Isaiah Berg, EN 2019, Tyler Brandt, LA 2019, Rohan Gupta, LA 2019, and Bailey Winston, LA 2020, represented the club and we were tasked with determining the optimal launch angle for four major league hitters. Rohan has a second major in economics and strategy; Bailey has a second major in marketing.
The fly ball revolution has taken off over the past few years in baseball, with many players adjusting their swing paths to hit more balls in the air. Launch angle is the vertical angle with which the ball comes off the bat prior to any air effects. A straight line drive is 0 degrees, a hit straight down at home plate would be negative 90 degrees, and a popup right on top of home plate would be positive 90 degrees.
Many players, including Josh Donaldson and Daniel Murphy, have successfully adjusted their swing paths over the past few years to hit more fly balls, and thus more home runs.
To determine the optimal launch angle, we built a model that predicted a player’s production based on his mean launch angle.
Methodology
When we say production, we are essentially talking about weighted on-base average (wOBA), which captures the run-producing power of each player. A .320 wOBA is average, and a .400 wOBA is elite.
As for determining the optimal launch angle, we used Statcast data, available online at Baseball Savant. This data set includes the launch angle, exit velocity (the speed of the ball as it comes off the bat), spray angle (direction of the hit), pitch data, and the result of each pitch. Filtering the data through the mathematical model we created, we show the probability that a given batted ball will be a single, a double, a triple, a home run, or an out.
Another important consideration is the relationship between launch angle and exit velocity. The distribution of exit velocities with respect to launch angle is not uniform across all players. Thus, for each player we analyzed, we created another model that could show how different players will hit the ball harder at different launch angles. The model shows, for example, that given a launch angle of 20 degrees, Tommy Pham is 18 percent more likely to hit the ball at least 98 miles per hour than Marcell Ozuna is.
To get full season projections, we input an entire distribution of batted balls into our model. The model returned an expected number of singles, doubles, triples, and home runs. To calculate wOBA, we just applied the appropriate linear weights.
Results
For the actual competition at Diamond Dollars, we didn’t analyze any St. Louis Cardinals players. But after the competition, we ran our model on each starting position player for the Redbirds. Here is our model’s optimal mean projection for each Cardinals’ wOBA versus the rest-of-season Steamer projection.
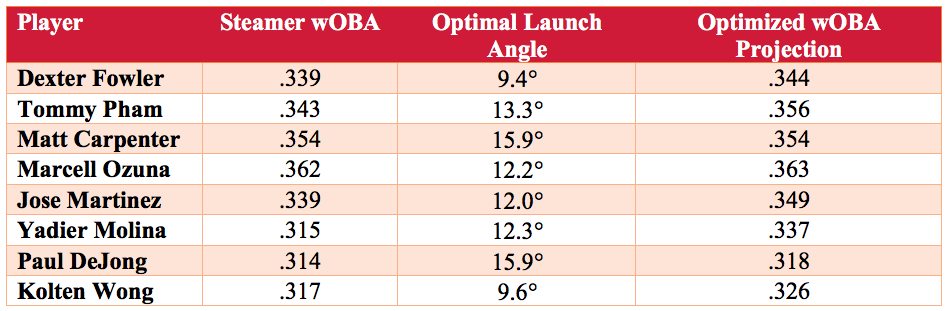 If our optimized projection is greater than that of Steamer, we believe either Steamer is too low on the player or he stands to gain a lot from adjusting his launch angle. When looking at these numbers, keep in mind that these are mean projections for those players at a given launch angle. Our model relies heavily on predicting the results of balls in play, which is much harder to do than predicting strikeout and walk totals. Weird things can happen in the field, so we recognize that in some extreme cases, a player will be 10 or more points off from our projection while having the same launch angles, exit velocities, and spray angles we expect.
Two examples of the latter case would be Tommy Pham and Yadier Molina. In his breakout season last year, Pham had a mean launch angle of just 7 degrees. But he hit the ball with such great exit velocity that his overall numbers were fantastic anyway. Our model projects him for about a .348 wOBA if he stays at 7 degrees, but a .356 wOBA if he increases his mean launch angle to 13.3 degrees this season. That adjustment is worth about 0.4 wins over the course of a full season, which equates to roughly $3.5 million (or the offensive difference between Jedd Gyorko and Kolten Wong).
Molina actually over-adjusted last season. Molina increased his mean launch angle to 15.2 degrees in 2017. This led to his first double-digit home run season since 2013, but it came at the cost of 26 points in wOBA from the year prior. Our model suggests that he should get back up to his 2016 level of production, when he had a .360 on-base percentage, if he decreases his launch angle by 3 degrees.
Like most teams, the Cardinals have a couple of players who would stand to gain from a launch angle adjustment. Contact washusportsanalytics@gmail.com if you are interested in hearing more.
About the Author

Guest Author
Media inquiries
For assistance with media inquiries and to find faculty experts, please contact Washington University Marketing & Communications.
Monday–Friday, 8:30 to 5 p.m.
Sara Savat
Senior News Director, Business and Social Sciences