The WashU Olin MBA

Transform your career with a WashU Olin master’s degree in business administration.
We offer our MBA in a variety of formats to fit your needs and lifestyle. However you want to earn your degree — full-time or part-time, on campus or online — you’ll become a skilled, decisive leader prepared for a future of success and impact.
MBA programs
Full-Time MBA
Consistently ranked among the best full-time MBA programs, WashU Olin stands out among its peers. Become a principled leader prepared to make a difference.
Read more about "Full-Time MBA"The Part-time Flex MBA, Online or On Campus
Take classes online, on campus or both. Get the full rigor of our traditional MBA with the flexibility you need as a modern working professional.
Read more about "The Part-time Flex MBA, Online or On Campus"Executive MBA
Olin’s top-rated Executive MBA program includes personalized leadership coaching and works with your busy schedule. We also offer EMBA degrees in Shanghai and Mumbai.
Read more about "Executive MBA"Why Olin?
Considered one of the finest business schools in the United States, Olin has built its MBA curriculum atop a foundation of four pillars of excellence and a spirit of collaboration. With a WashU MBA, you’re prepared to tackle the greatest challenges of our day while honing your established principles.
Learn more about why Olin’s a great choice for your MBA.
WashU Olin MBAs by the numbers
#26
best business program
US News and World Report 2024
169%
average salary increase
postgraduation for Full-Time MBAs
85%
of all Professional MBA candidates
earn their degree within 3 years
100+
elective courses for Flex MBA students
34%
underrepresented people of color
incoming Full-Time MBA class of 2023
26,000+
alumni actively engaged with Olin
Your MBA ROI
An Olin MBA sets you up for life. Your experience here earns you not only mastery in the fundamentals of business but also vital interpersonal skills and a values-first perspective. All business schools teach you the hard facts of economics and management; WashU Olin prepares you to lead on a global scale, drawing upon a network of thousands of fellow students and alumni, faculty, and business leaders at every stage of your career.
Olin’s elite rankings stand as evidence of our commitment to your education and your professional journey. Our values underscore our commitment to shaping a new generation of thoughtful leaders intent on changing business, for good. And that is a priceless investment.
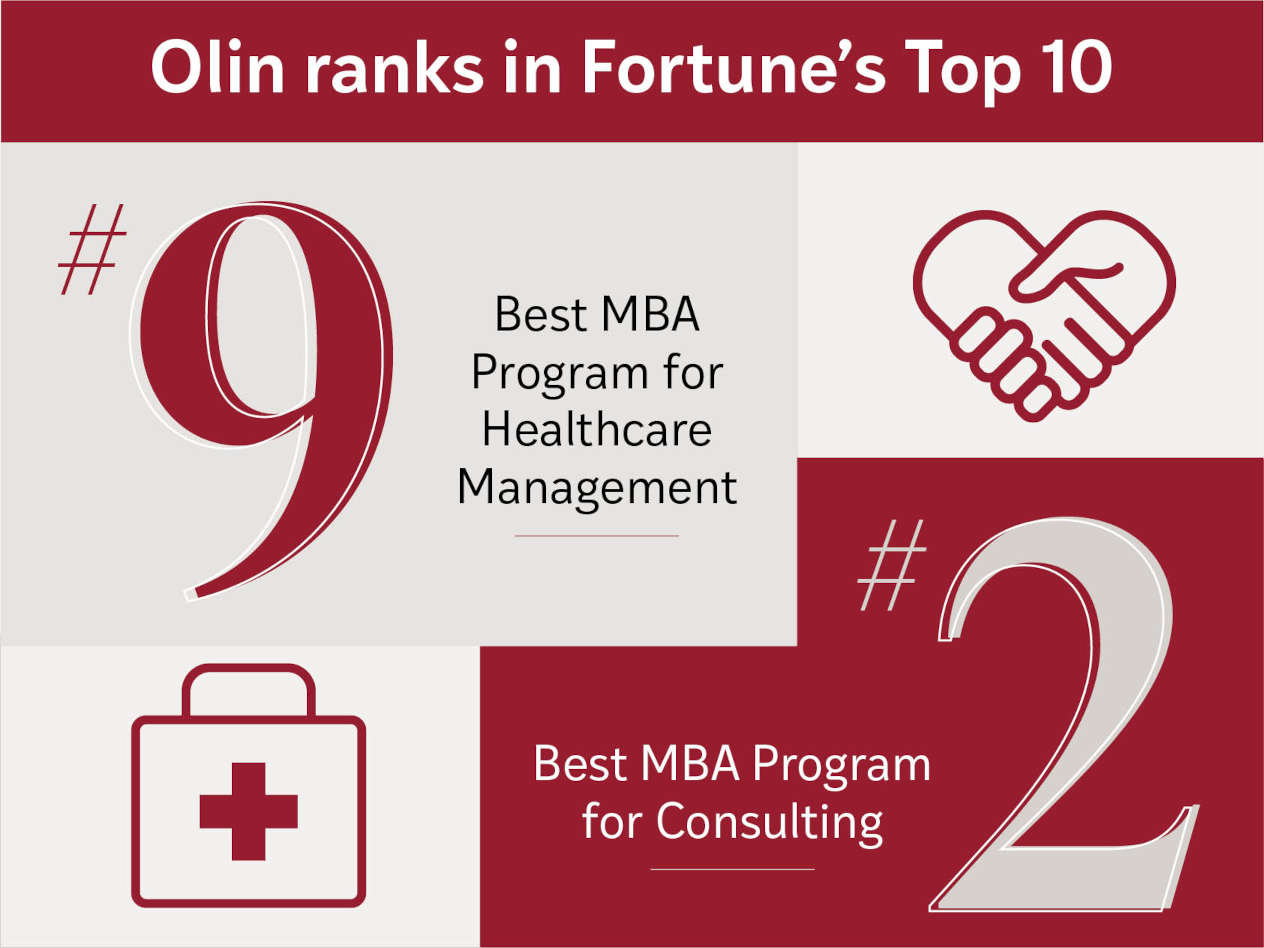
Olin ranks high in Fortune for consulting & healthcare management
December 10, 2024
2 minute read

Olin MBA fellowship helps with ETA or family business goals
December 6, 2024
2 minute read